1
2
3
4
5
6
7
8
9
10
11
12
13
14
15
16
17
18
19
20
21
22
23
24
25
26
27
28
29
30
31
32
33
34
35
36
37
38
39
40
41
42
43
44
45
46
47
48
49
50
51
52
53
54
55
56
57
58
59
60
61
62
63
64
65
66
67
68
69
70
71
72
73
74
75
76
77
78
79
80
81
82
83
84
85
86
87
88
89
90
91
92
93
94
95
96
97
98
99
100
101
102
103
104
105
106
107
108
109
110
111
112
113
114
115
116
117
118
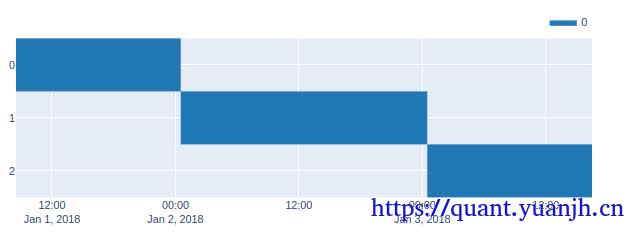
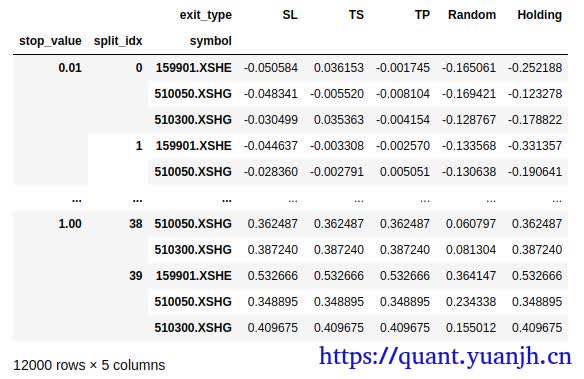
| 时间区间回测:
open_roll_wbuf, split_indexes = ohlcv_wbuf['Open'].vbt.range_split(
range_len=(ts_window + time_buffer).days, n=ts_window_n)
print(open_roll_wbuf.shape)
print(open_roll_wbuf.columns)
(465, 50)
Int64Index([0, 1, 2, 3, 4, 5, 6, 7, 8, 9, 10, 11, 12, 13, 14, 15, 16, 17, 18, 19, 20, 21, 22, 23, 24, 25, 26, 27, 28, 29, 30, 31, 32, 33, 34, 35, 36, 37, 38, 39, 40, 41, 42, 43, 44, 45, 46, 47, 48, 49], dtype='int64', name='split_idx')
比较容易理解,原始的1列数据,copy出50列,列索引从0-49。
# This will calculate moving averages for all date ranges and window combinations
fast_ma_roll, slow_ma_roll = vbt.MA.run_combs(
open_roll_wbuf, np.arange(min_window, max_window+1),
r=2, short_names=['fast_ma', 'slow_ma'])
print(fast_ma_roll.ma.shape)
print(fast_ma_roll.ma.columns)
(465, 242550) # 4851*50=242550
MultiIndex([( 2, 0),
( 2, 1),
( 2, 2),
( 2, 3),
( 2, 4),
( 2, 5),
( 2, 6),
( 2, 7),
( 2, 8),
( 2, 9),
...
(99, 40),
(99, 41),
(99, 42),
(99, 43),
(99, 44),
(99, 45),
(99, 46),
(99, 47),
(99, 48),
(99, 49)],
names=['fast_ma_window', 'split_idx'], length=242550)
从原始的常规columns数字索引,变成数字pair的二维multi索引。
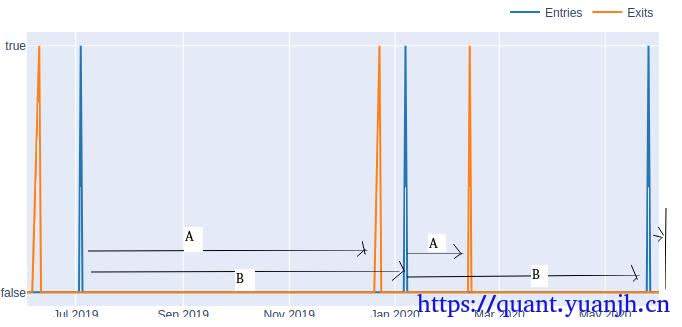
# Generate crossover signals
dmac_entries_roll = fast_ma_roll.ma_crossed_above(slow_ma_roll)
print(dmac_entries_roll.columns)
MultiIndex([( 2, 3, 0),
( 2, 3, 1),
( 2, 3, 2),
( 2, 3, 3),
( 2, 3, 4),
( 2, 3, 5),
( 2, 3, 6),
( 2, 3, 7),
( 2, 3, 8),
( 2, 3, 9),
...
(99, 100, 40),
(99, 100, 41),
(99, 100, 42),
(99, 100, 43),
(99, 100, 44),
(99, 100, 45),
(99, 100, 46),
(99, 100, 47),
(99, 100, 48),
(99, 100, 49)],
names=['fast_ma_window', 'slow_ma_window', 'split_idx'], length=242550)
信号由原来的2维pair变成3维pair。
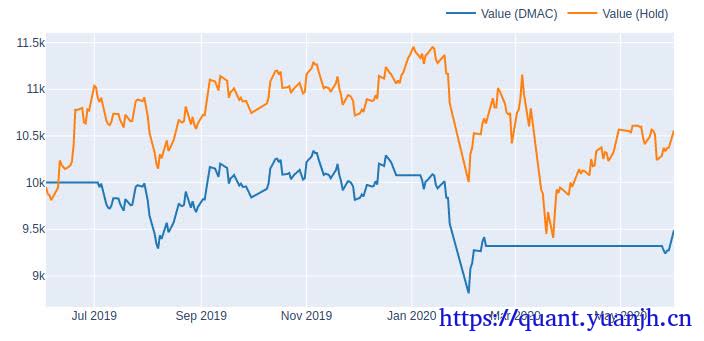
# Calculate the performance of the DMAC Strategy applied on rolled price
# We need to specify freq here since our dataframes are not more indexed by time
dmac_roll_pf = vbt.Portfolio.from_signals(close_roll, dmac_entries_roll, dmac_exits_roll, freq=freq)
dmac_roll_perf = dmac_roll_pf.deep_getattr(metric)
print(dmac_roll_perf.shape)
print(dmac_roll_perf.index)
(242550,)
MultiIndex([( 2, 3, 0),
( 2, 3, 1),
( 2, 3, 2),
( 2, 3, 3),
( 2, 3, 4),
( 2, 3, 5),
( 2, 3, 6),
( 2, 3, 7),
( 2, 3, 8),
( 2, 3, 9),
...
(99, 100, 40),
(99, 100, 41),
(99, 100, 42),
(99, 100, 43),
(99, 100, 44),
(99, 100, 45),
(99, 100, 46),
(99, 100, 47),
(99, 100, 48),
(99, 100, 49)],
names=['fast_ma_window', 'slow_ma_window', 'split_idx'], length=242550)
数据格式转换:
# Unstack this array into a cube
dmac_perf_cube = dmac_roll_perf.vbt.unstack_to_array(
levels=('fast_ma_window', 'slow_ma_window', 'split_idx'))
print(dmac_perf_cube.shape)
(98, 98, 50)
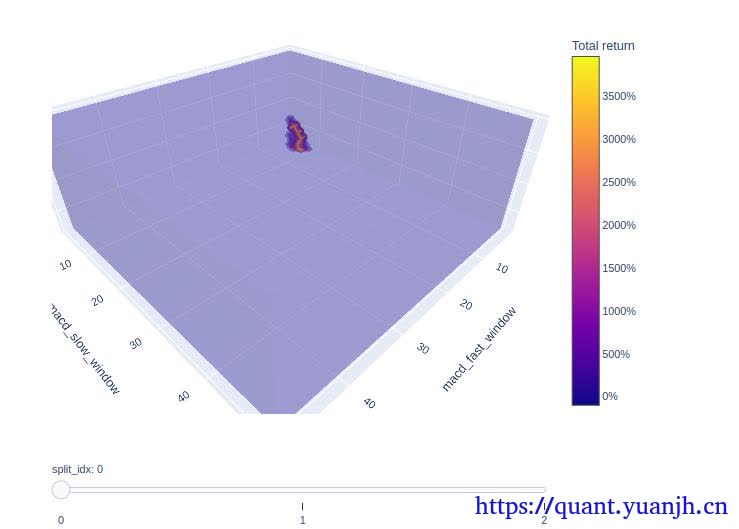
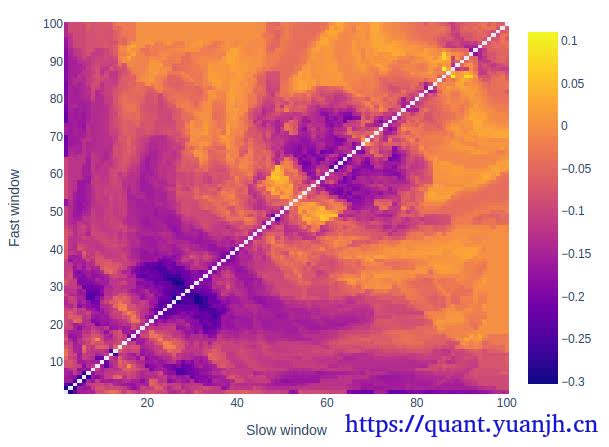
绘制fast-slow windows回测结果图
# For example, get mean performance for each window combination over all date ranges
heatmap_index = dmac_roll_perf.index.levels[0]
heatmap_columns = dmac_roll_perf.index.levels[1]
# np.nanmean取平均,所以最后是二维图而非立方体,https://www.python100.com/html/96013.html
heatmap_df = pd.DataFrame(np.nanmean(dmac_perf_cube, axis=2), index=heatmap_index, columns=heatmap_columns)
heatmap_df = heatmap_df.vbt.make_symmetric()
heatmap_df.vbt.heatmap(
xaxis_title='Slow window',
yaxis_title='Fast window',
trace_kwargs=dict(zmid=0, colorscale='RdBu')).show_svg()
|